Noob hydrology
The initial goal was to simulate how a flood might affect the road network.
I had seen others using satellite imagery of previous floods, but this seemed less relevant to the area I was observing. (https://www.youtube.com/watch?v=LXi4s21vjAw)
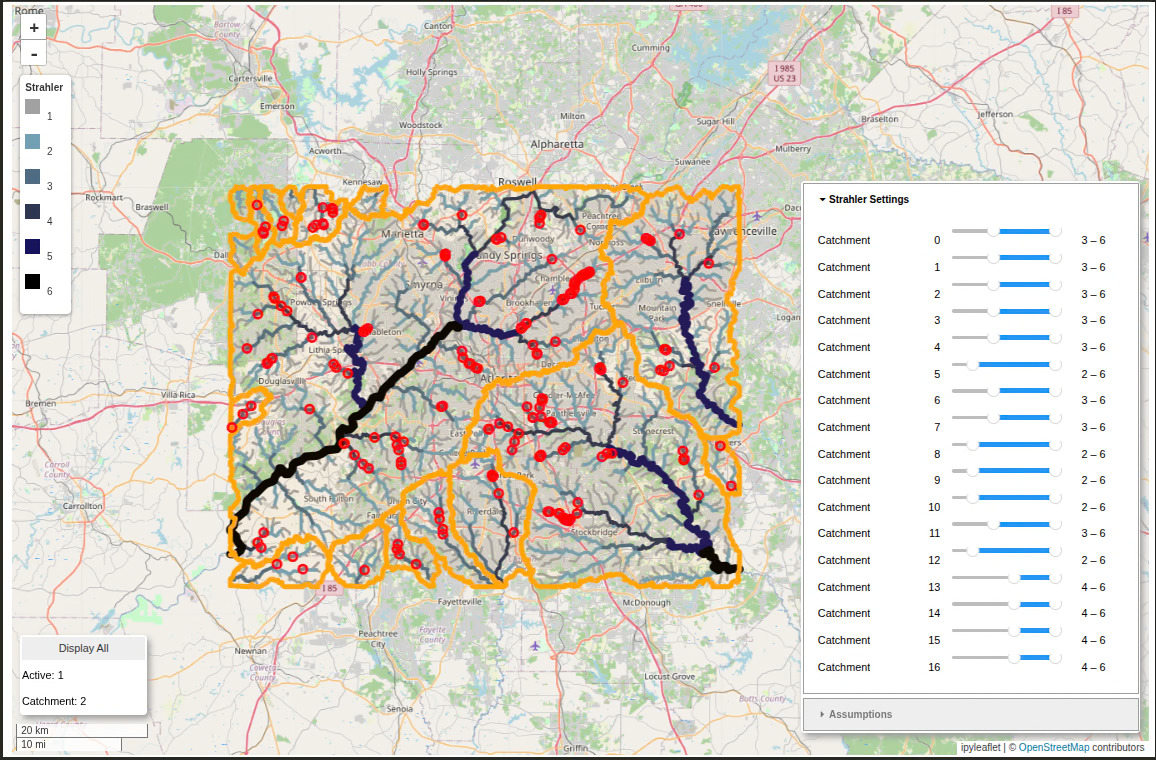
Instead I processed DEM 10m tif data in QGIS. With a lot of RAM (used ~25GB for ATL area) and “DDM Hydrologic” in QGIS, we can generate flowpaths and cachements.
Flooding is simulated by breaking roads that intersect with high enough strahler flowpaths. I made an ipyleaflet to interact with the data. There are settings to adjust parameters such as exclude certain built up infrastructure like as bridges/highways. Code
Once the map is created, it is then converted to obf via osmandmapcreator. This finished map can be navigated to see how routing is impacted by the simulated “flooded” environment.