Census data regression?
I was going through this website, enjoying the ACS data. However, the data was over a decade old, so I sought out the updated data.
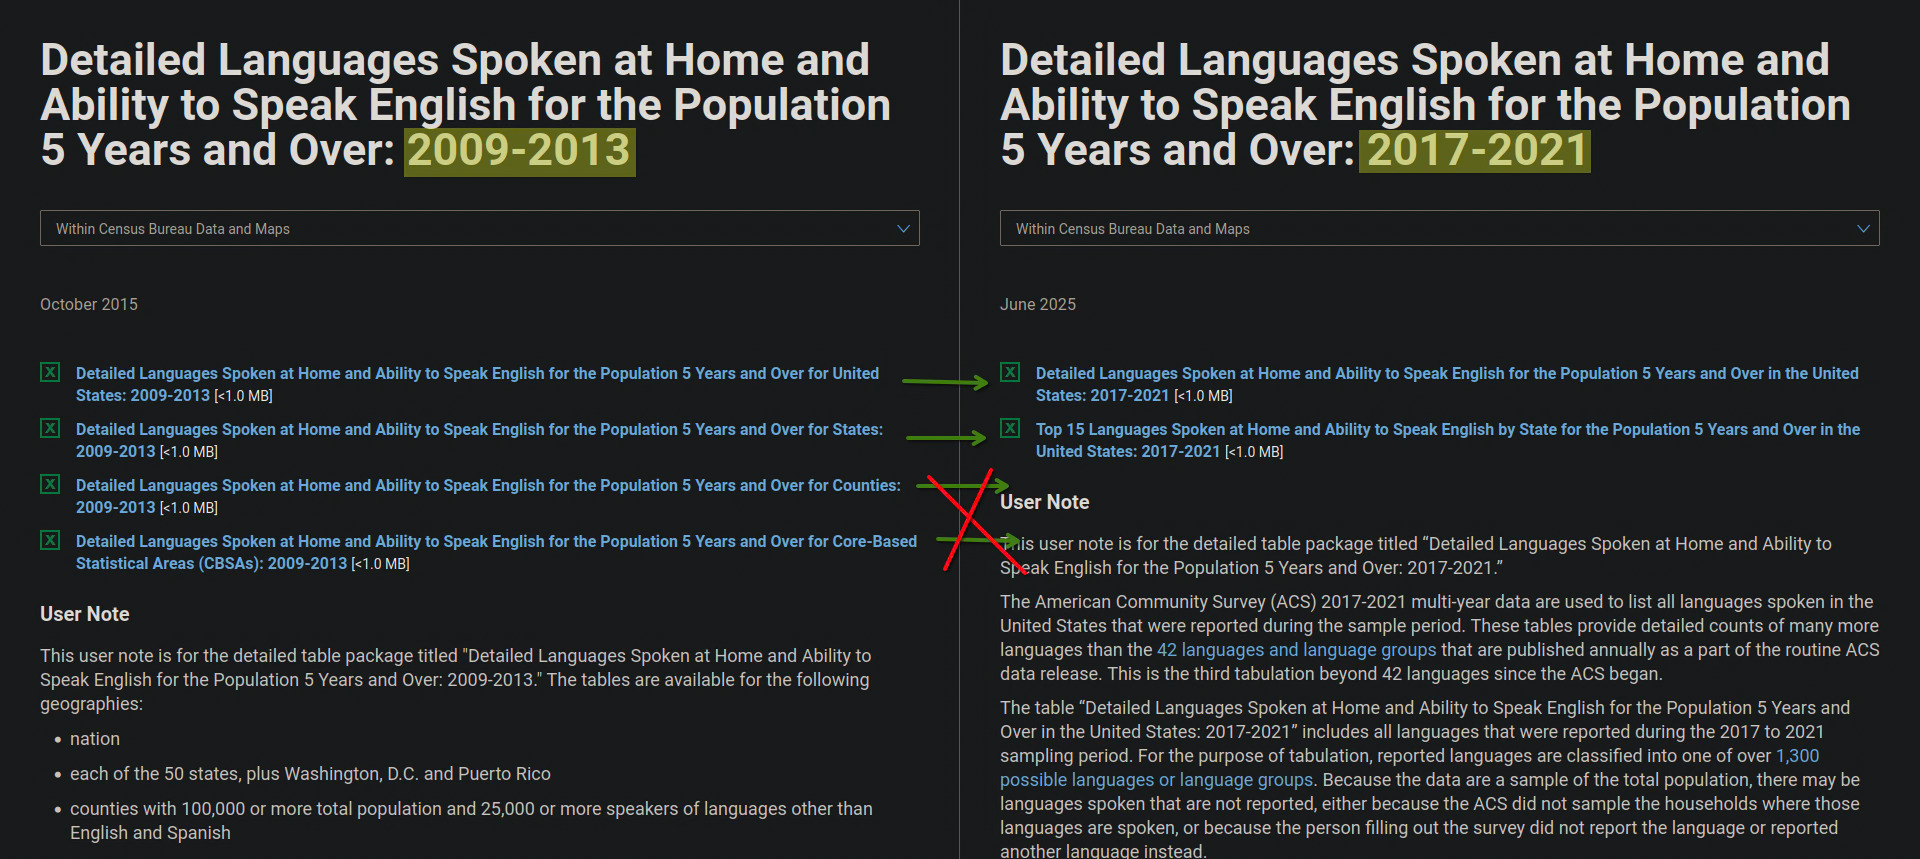
I ended up finding out that the dataset had regressed a lot in its latest release.
https://www.census.gov/topics/population/language-use/data.html
The dataset is not particularly useful for any regional or state level analysis.
The data may have some utility for those languages not captured in the designated 42 languages
So if you’re interested in Language Use Data the correct place to get such data is not through Census.gov / Topics / Population / Data
Instead you have to manually retrieve the data through https://data.census.gov/. Albeit it has to be one of the designated 42 languages.
Within the ACS data the table I went with was B16001.
The Changes
Language Caps over 10k:
| State | 15th Language Group Size |
|---|---|
| California | 133,200 |
| New York | 62,460 |
| Texas | 37,580 |
| New Jersey | 36,050 |
| Illinois | 25,270 |
| Florida | 21,970 |
| Massachusetts | 20,570 |
| Pennsylvania | 18,280 |
| Washington | 16,860 |
| Virginia | 15,870 |
| Maryland | 14,450 |
| Georgia | 14,410 |
| Michigan | 14,250 |
| Ohio | 10,110 |
| North Carolina | 9,975 |
Not only is there a loss of the county level data & CBSA (Core Based Statistical Areas; ie Metro Areas). But the remaining State data is limited to the top 15 languages with speakers.
Fifteen may sound like a lot, but for larger states it can end up erasing fairly large groups of speakers. This issue particularly impacts states with more diverse speakers like New York.
This restriction creates a “language cap”, below which a language group is not counted.
The only languages to have full 50 state coverage are Spanish and Chinese!
The Actual Data
As stated at the start it’s necessary to find and filter through the data from
https://data.census.gov/
The table I went for was B16001. Selecting the recent 5-year ACS dataset, then transposing and restricting to the language of interest.
The ACS question:
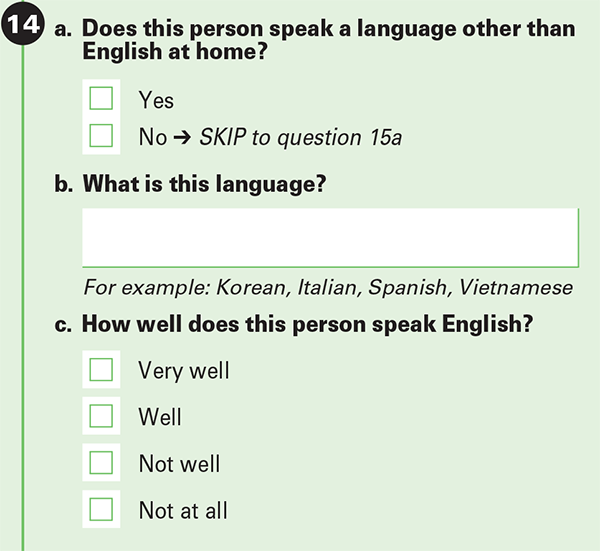
full questionnare: https://www.census.gov/programs-surveys/acs/about/forms-and-instructions.html