ACS Japanese Speaker Data (Under Construction)

I needed some language data, so I ended up making something similar to this site: https://probablyhelpful.com/languages/Japanese.html. Except with newer data, more visualizations, searchable tables, and some helpful statistics.

Why

There are a number of factors unique to Japanese that create upward wage pressure for bilingual speakers (me).
From the demand side:

  1. Japan is and has been the country with the most direct investment in the US. src1, src2
  2. Japan is the fourth largest economy (investment target) src3, fifth when adjusting for PPP src4

On the supply side:

  1. Japan ranks poorly in the “English Proficiency Index”. src5
  2. Japanese is among the hardest language to learn for English speakers (along with Arabic, Chinese, Korean). src6
  3. Japan has a small emigrant population relative to its population size. src7 (Source available through wayback machine)
  4. Regional concentrations/disparities within the US (the purpose of this analysis). src8=myself+ACS data

Together, these factors make Japanese a uniquely valuable language in the US. China/Chinese is similar in some respects, but lacks, basically any, direct investments into the US. For reference, in 2025 Austria had more direct investment into the US than China.

As an aside, I wish the BLS would release language specific data on Interpreters and Translators. Rather than the general translator bucket. (How am I supposed to interpret the wage data!)
There is also the complication of specializations that require language ability as an addition, but are not a “translator” role. With the right data I imagine they could create an average % wage premium that a language adds.
An example wherein they identified the wage premium a foreign language skill provided (in Poland).

Data

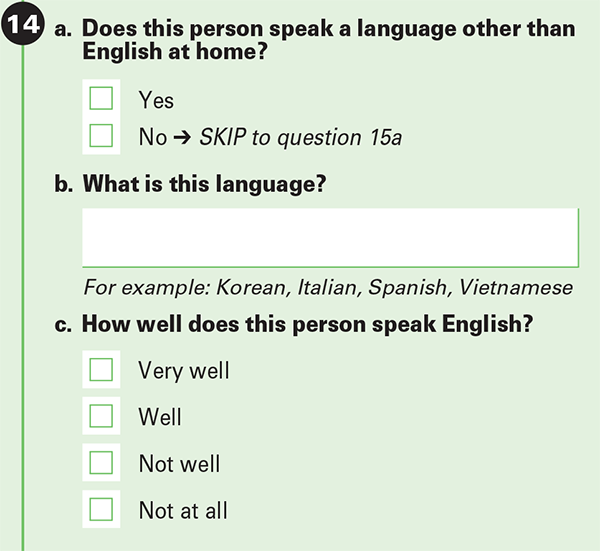
The ACS question:

The data originates from https://data.census.gov/.

U.S. Census Bureau. “Language Spoken at Home by Ability to Speak English for the Population 5 Years and Over.” American Community Survey, ACS 5-Year Estimates Detailed Tables, Table B16001.

full questionnare: https://www.census.gov/programs-surveys/acs/about/forms-and-instructions.html

Observations

Alaska, Utah, Nevada stood out as locations not traditionally associated with a Japanese diaspora, but had relatively high populations of Japanese speakers.
Visualizations 見える化

Code
import pandas as pd
import geopandas as gpd
import folium
import itables
import geoplot

jpmap = gpd.read_file("../../census/jpmap.gpkg")
# jpmap = jpmap.rename({"STUSPS":"State", "NAME":"State Full", "osmid":"ID", "url":"URL"}, axis=1)

itables.show(pd.DataFrame(jpmap[jpmap.columns[:13]]), maxBytes=200000, style="width:100%", 
                                    buttons=["pageLength", {"extend": "colvisGroup","text": "Hide Errors","hide": [2,4,6,8,10]},
                                                            {"extend": "colvisGroup","text": "Show all","show": "*"}],
                                    columnDefs=[{"className":"dt-left", "targets":[0]}, 
                                                {"targets":[2,4,6,8,10], "visible":False}],
                                    columnControl=["order"],
                                    ordering={"indicators": False, "handler": False})
state total etotal eng eeng jpn ejpn bilingual ebilingual jpnbad ejpnbad percentjpn percentbilingual
alabama4793030601450321853592528541122841413003270.0527430.025621
alaska6890701695851622727149439010332814612540.2168140.149912
arizona69813202855184054115447952907511970628335110.1139040.073324
arkansas2869111548263045144419352664951954402180.0325880.017253
california37121454487206426385445013341945947890031905451922220.3594120.212546
colorado5549558577465028392235893658449456313992660.1061890.080979
connecticut34428179026383666723328164023225049593290.0953000.067445
delaware9665804682033634328052726032292021020.0832830.062385
district of columbia64084166518478320410542856922443621450.1644710.107983
florida212897287071476945825976122221183815399340696470.0574080.038295
(41 more rows not shown)
Code
itables.show(pd.DataFrame(jpmap.loc[:,["total","eng","jpn","bilingual","jpnbad","region"]]), maxBytes=200000, 
                                    style="width:100%", buttons=["pageLength"],
                                    columnDefs=[{"className":"dt-left", "targets":[0]}],
                                    columnControl=["order"],
                                    ordering={"indicators": False, "handler": False})
total eng jpn bilingual jpnbad region
47930304503218252812281300south
68907058516214941033461west
69813205184054795251192833west
28691112630451935495440south
37121454206426381334197890054519west
55495584650283589344941399west
3442817263836632812322959northeast
966580820336805603202south
6408415184781054692362south
21289728147694581222281534069south
(41 more rows not shown)
Code
regionallang = jpmap.loc[:,["total","eng","jpn","bilingual","jpnbad","region"]].groupby(["region"], as_index=False).sum()
regionallang["percentjpn"] = (regionallang.jpn * 100) / regionallang.total
regionallang["percentbilingual"] = (regionallang.bilingual * 100) / regionallang.total
itables.show(regionallang, maxBytes=200000, style="width:100%",
                                    columnDefs=[{"className":"dt-left", "targets":[0]}],
                                    columnControl=["order"],
                                    ordering={"indicators": False, "handler": False})
region total eng jpn bilingual jpnbad percentjpn percentbilingual
midwest65194303572296245847333954245190.0896900.052081
northeast54393479411993276816341873262900.1253150.076982
south121811243967114529603659928361080.0788400.049197
west7474352350626636239733148271914620.3207410.198373
Code
# m = folium.Map([37, -100], zoom_start=4)

# marker_cluster = MarkerCluster(disableClusteringAtZoom=10).add_to(m)

# for idx, row in nodirgdf.iterrows():
#     popup_html = f"<style> th\
#                 {{border:1px solid black;\}}</style>\
#                 <table><tr>\
#                     <th>State: </th>\
#                     <th>{row['State Full']}</th>\
#                 </tr><tr>\
#                     <th>ALPR ID: </th>\
#                     <th>{row['ALPR ID']}</th>\
#                 </tr><tr>\
#                     <th text-align='center' colspan='2'>{row['url']}</th>\
#                 </tr></table>"
#     folium.Circle(
#         location=[row.geometry.y, row.geometry.x], 
#         popup=popup_html, fill=True, radius=30, weight=9,color="#9E2F02",opacity=0.8,fillOpacity=0.5
#     ).add_to(marker_cluster)

# m

Other Stats

203,771,037 / 316,142,548 = 64.5%
of the general populace is working age (18 to 64)
8,030,466 / 11,320,253 = 70.9%
among those who Speak Asian and Pacific Island language
4,734,803 / 8,030,466 = 59.0%
speak english “very well” among working age API lang speakers
4,734,803 / 11,320,253 = 41.8%
working age speak english “very well” among all API lang speakers
2024 ACS 5-Year Estimates, Table B16004